Abstract:
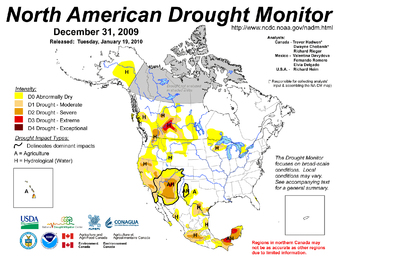
The North American Drought Monitor is an operational map and narrative produced monthly through a collaborative effort of scientists in the United States, Canada, and Mexico. It is an integrated assessment of drought conditions across the North American continent based on national drought analyses conducted within each of the three participating countries. Continental drought indicators computed from in situ observations, modeled data, and satellite data are used to assess conditions in cross-border areas. The drought assessment is depicted on the NADM map as drought categories: D0 (abnormally dry), D1 (moderate drought), D2 (severe drought), D3 (extreme drought), and D4 (exceptional drought). The drought categories correspond to percentile categories of dryness: D0 (21-30 percentile), D1 (11-20 percentile), D2 (6-10 percentile), D3 (3-5 percentile), D4 (0-2 percentile). Drought impact categories (A for agriculture and H for hydrological) are also depicted. The NADM map product shows drought category contours and is manually created in an ArcGIS environment. The following data are used in the analysis process: In Situ Networks: U.S.: Cooperative Station Network, Climate Division Data Base; Canada: DLY02 and DLY04 Station Network; Mexico: Station Network. Satellites: NOAA-7, 9, 11, 14, 16 and 18 afternoon polar-orbiting satellites. Satellite Instruments: Vegetation Health Indices (VHI) derived from the radiance observed by the Advanced Very High Resolution Radiometer (AVHRR). In situ data are point measurements, satellite data (VHI) have 4 km spatial resolution, and modeled soil moisture data are produced on a 0.5 by 0.5 degree grid.